Evaluating My Own Estimates for NFL Win Totals
August 27, 2024
Download PDF version
Background
I have developed a fantasy football predictive model, which I’ve called FFF. You can see more details about this model here: FFF (ekrusinski.com). The idea behind it is there are several factors that can predict fantasy football performance, and some of these factors won’t be known until the end of the season. So I decided to make my own estimates of these unknown factors with the thought that if any of them are incorrect, they can be covered by the other factors.
One of the factors I do estimate year-by-year, then, is NFL team win totals. I basically do this by using odds from sports bets as a starting point and then use my intuition to modify it as necessary.
How good are my estimates? I will use regression analyses to check the correlation to final win totals.
Analysis of Predicted Win Percentage
Most of the analysis in this project will be done using Microsoft Access and Excel. For reference, I have a pro football Access database that I have been maintaining for about 20 years. I wanted to try this along with Python to get more accustomed to the tool, but I know that the Access database is robust and the data is clean.
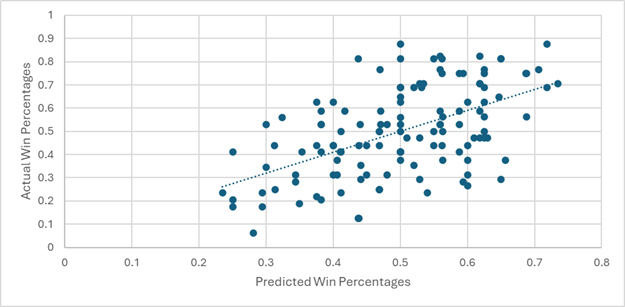
The scatterplot below shows actual win percentage of NFL teams compared to my predictions. The data includes all 32 teams between 2019 and 2022 (128 records).
The trendline for this scatterplot has a R2 value of 0.30, which means my prediction can translate to 30% of actual values, so I definitely have some room to improve. Also, the slope for this trendline is 0.90, which means I tend to predict teams to be a little better than they really are. That makes sense considering my overall tendencies. Let’s compare this to other less subjective methods of predicting NFL win percentages.
Sports Betting Odds Compared to NFL Win Percentages
As mentioned above, I generally predict win percentages by first looking at gambling odds before the beginning of the season. With that in mind, let’s look at betting odds to see if my modifications were better or worse at correlating to the final win percentages.
Below is a scatterplot to compare actual win percentage to gambling odds. Again, I included all 32 NFL teams and data from 2019 to 2022 (128 records). Also, for reference, I used www.SportsOddsHistory.com/nfl-odds to gather all the over-under win projections from the previous seasons. All the data was collected right before the first game of each season from the Westgate Las Vegas Race and Sports SuperBook.
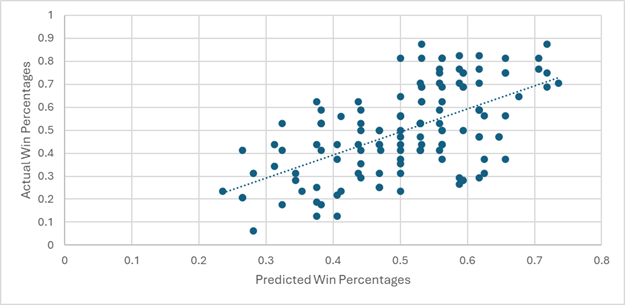
The trendline in this case has an R2 value of 0.35 and a slope of 1, so it is better than my projections.
EPA to Predict NFL Win Percentages
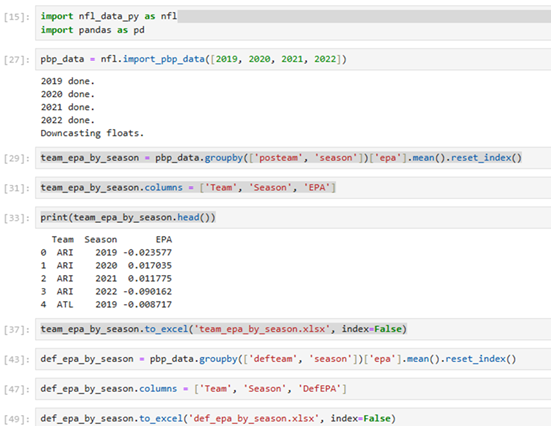
This is where I wanted to get my practice in for Python. Expected Points Added, or EPA, is a measurement of value for each play of each game. You can average this for each team to get an idea of their offensive value per season. Likewise, you can also average EPA for each team as the defending team per game to get a sense of the value of each team’s defense. Below is a snapshot of the code I used in Python to pull this data and save it in Excel to later import it to Microsoft Access.
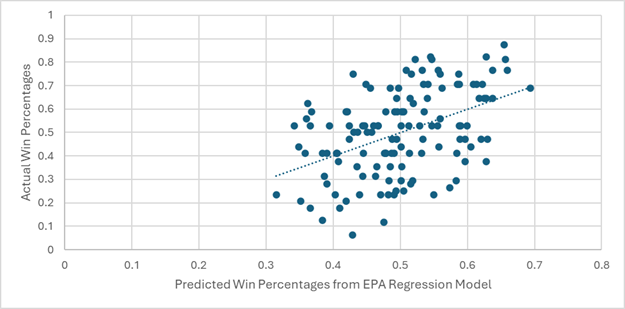
With this, I looked at each team’s EPA and defensive EPA per game for each season between 2019 and 2022, and I compared it to the win percentages for the next season to see if the EPA’s of the previous seasons could carry over to the performance of the next season.
Since this involves two input variables (EPA and defensive EPA), I did this as a multiple regression analysis. Both variables seem to have a strong relationship with win percentage as the p-value for EPA is 1.15 x 10⁻⁶ and the p-value for defensive EPA is 0.017. However, the R2 value is only 0.20, which means overall it is not a good correlation, at least compared to my predictions. See the scatterplot of this comparison below.
EPA appears to be an effective metric, but to consider EPA of one year to predict the performance of the next year seems a little complex. Perhaps I should just simply look at the winning percentage of one year to see if it can predict the winning percentage of the next year.
Correlation of Win Percentage from One Year to the Next Year
Below is a scatterplot of win percentages for each NFL team from 2019 to 2022 to see how they compare to the win percentages of the following year. For example, I want to see if the win percentage of the Arizona Cardinals in 2019 can predict their win percentage in 2020.
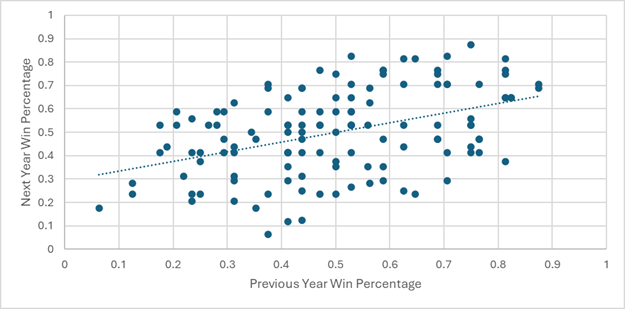
The R2 value in this case is even worse at 0.19.
Researched Models to Predict Win Percentages
Next, I thought I would do some research for other predicted models available to the public. After all, if the subject is predicting wins and the NFL, one would think that something is available. Unfortunately, it appears that most models available to the public are set up as machine-learning (ML) type models that run game-by-game instead of as a model to predict the entire season.
I could not find any explicit models to predict win percentages for the entire season, as I am sure many of these are proprietary. However, I found a few possible factors for these models, including those that were used to determine preseason power rankings, unofficial rankings done for all 32 NFL teams. (Incidentally, I did a separate model to see if power rankings could predict win percentage, and the results were no better than my predictions since the R2 value was 0.265.) BetIQ (NFL Preseason Predictions and Rankings 2022 | BetIQ (teamrankings.com)) was one such example that showed factors that went into a preseason predictive model, including factors like who the quarterback and coach is for the team.
Based on my research, I wanted to try one more multiple regression model that focused on the following factors: previous win percentage, EPA, strength of schedule, and the quarterback’s passer rating from the previous year. I picked all these factors because they are all independent of each other.
I already had quarterback rating data in my Access database, but it was still challenging to figure out who the main quarterback was for each of the 32 teams between 2019 and 2022 and then find out what that quarterback’s passer rating was the previous year. To do this, I looked up which quarterbacks put up statistics for each team between 2019 and 2022. In some cases, because of injuries, I had to do some additional research to make sure I captured the quarterback that was expected to start the season for each team. Then, I had to look up that quarterback’s rating in the previous year. For rookies, I had to leave those records as blank.
Once I was able to put together all the data, I exported it from Access to Excel and then ran the multiple regression analysis. Below is a snapshot of the output from Excel.
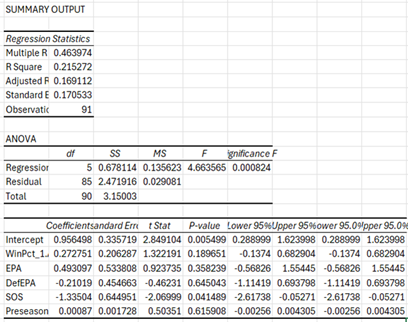
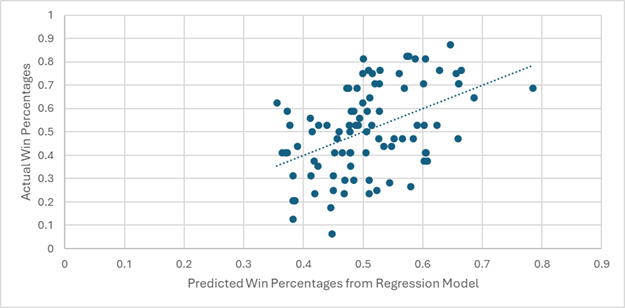
As shown, the results are still not favorable since R2 is 0.215 and the p-values for all the factors except strength of schedule is above 0.05. Furthermore, here is the scatterplot of the regression model compared to actual values.
Conclusion
My own personal predictions for NFL wins are comparable to other models, but they are based on sportsbook odds for win totals, which are actually better. At this point, for preseason predictions, the best method is to trust the sportsbook odds. This makes sense considering that data scientists are hired to make these predictions, so it is fair to trust their calculated methods to determine the best predictions.